BENTO-ENVIRO v1.000
Your environment in one view
TOULOUSE
10/24/2025, 5:56:11 AM (UTC+2)
BROKEN CLOUDS
Cloud coverage 75%
12°C
Feels 11°C
1015 hPa
82%
10 km
Force 3/12
Gentle Breeze
19 km/h
(10 kts)
270°
→
14 km/h gusts
(8 kts)
No fall recorded
04:44
05:17
05:50
Sunrise 06:18
Noon 11:38
Sunset 16:58
Day length 10.66h
17:26
17:59
18:32
🔴CAM 1/4
Muret › West: Lherm - Mid...

10/23/2025, 5:26:22 PM
🔴CAM 2/4
Toulouse: Bazacle

10/24/2025, 4:47:47 AM
🔴CAM 3/4
Frouzins › South-East: Ré...

10/24/2025, 5:53:08 AM
🔴CAM 4/4
Labege: Environs du Palay...

10/24/2025, 5:25:23 AM
•
•
•
•
•
•
•
•
Moonrise: ??:??
Moonset: ??:??
unknown (%)
Transit: ??:??
Age: null days
City sky
Bortle class
8/9 of 9
SQM
18.34/22.00
mag./arc sec2
Total bright.
4.98
mcd/m2
Artificial bright.
4.811
mcd/m2
Natural bright.
0.17
mcd/m2
Ratio
28.1
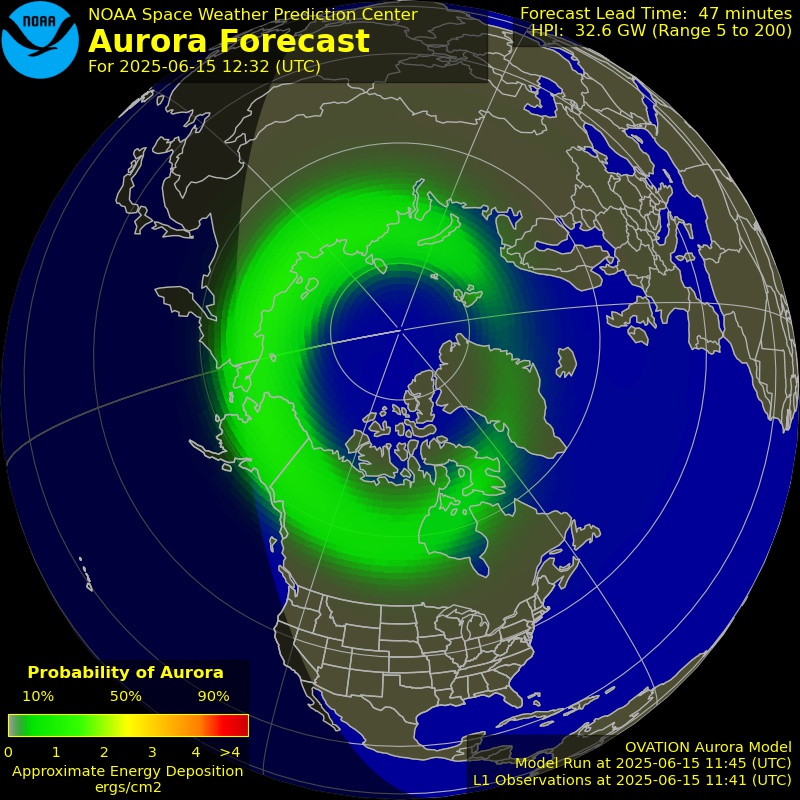
Kp-index: 0
Air Quality 22
Good
CO
...
μg/m3
NO2
2.9
μg/m3
O3
21.1
μg/m3
PM10
9
μg/m3
PM2.5
22
μg/m3
SO2
...
μg/m3
No pollen data available
DD(WGS84)
43.600000, 1.440000
DDM(WGS84)
43°36.000'N, 1°26.400'E
DMS(WGS84)
43°36'0.00"N, 1°26'24.00"E
UTM(WGS84)
E: 374090, N: 4828629
MGRS(WGS84)
31TCJ7409028629
APIs, Credits
Weather: Open Weather MapSun: Sunrise-sunsetWebcams: WindyMoon: MeteoblueNight sky: David LorenzAurora forecast: NOAA SWPCAir quality: WAQICity search: Nominatim OSMSatellite: WindyReact, Vite, Swiper, Pako, Proj4, Recharts
TailwindCSS, Lucide, DepartureMono
Why is pressure important ?
Changes in atmospheric pressure are often associated with different weather patterns. High pressure typically brings fair weather, while low pressure is often associated with clouds, precipitation, and stormy conditions. By monitoring pressure trends, meteorologists can anticipate changes in weather conditions and issue forecasts accordingly.